Albania has continued to be Europe's poorest in 2018, according to preliminary data published today by Eurostat for EU countries and Western Balkans countries and Turkey.
The average income of Albanians was as much as 31% of the EU average, with a slight improvement from last year when this indicator was 30%. Together with Bosnia, with 31%, this is the lowest indicator in Europe (Eurostat data does not include Kosovo).
The highest income in the region has Montenegro, with 47% of the European average, followed by Serbia (40%), northern Macedonia (38%). For Turkey, this indicator is 65%.
Lower consumption by all
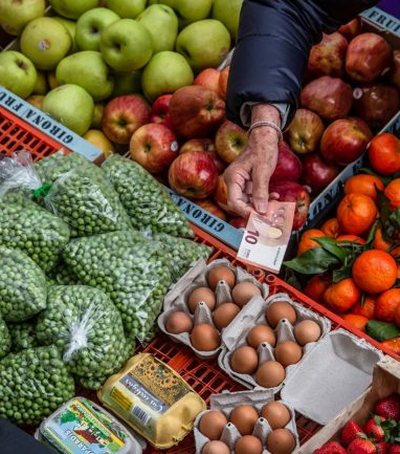
Although Albanians have similar income to Bosniaks, the most important indicator of the current individual consumption, which measures the well-being of their families and is expressed in terms of purchasing power parity, Albania is the poorest in Europe, with 38% of the average European Union. This is an indication that the cost of living in Albania is high in relation to income.
For Bosnia, per capita consumption is as much as 41% of the EU average. At the same level is Macedonia. The highest is again in Montenegro (57%), followed by Serbia (48%).
High variations in the European Union
Based on the first estimates for 2018, per capita consumption (AIC) expressed in Purchasing Power Standards (PPS) ranged from 56% to 132% of the European Union (EU) average in the Member States.
The ten member states recorded AIC per capita over the EU average in 2018. The highest EU level was recorded in Luxembourg, 32% above the EU average. Germany was about 20% higher, followed by Austria, Denmark, the United Kingdom, the Netherlands, Finland, Belgium, Sweden and France, which had levels between 5% and 15% above the EU average.
AIC per capita, for thirteen member states, stands between the EU average and 25% below. In Italy, Cyprus, Ireland, Spain and Lithuania the levels were 10% or less below the EU average, while the Czech Republic, Portugal and Malta were between 10% and 20% below and Poland, Slovenia, Slovakia and Greece between 20% and 25% % lower.
The six Member States recorded AIC per capita 25% or more below the EU average. Estonia was 26% lower, Latvia and Romania were 30% lower, while Hungary and Croatia had AIC per capita below 40% less than the EU average and Bulgaria was 44%.
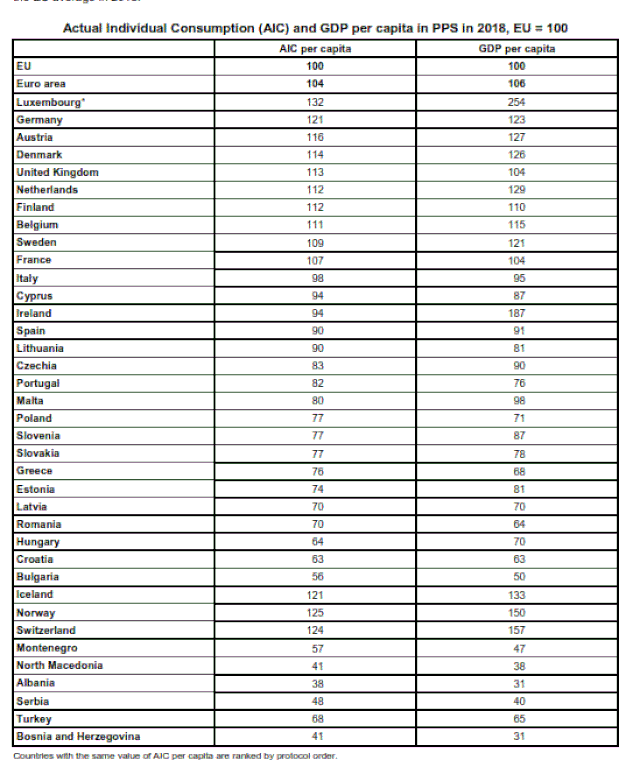
GDP per capita ranged from 50% in Bulgaria to 254% in Luxembourg
The EU's Gross Domestic Product (GDP) per capita, a measure of economic activity, also shows substantial differences between EU Member States. In 2018, GDP per capita expressed in PPS ranged between 50% of the EU average in Bulgaria and 254% in Luxembourg. Eleven Member States recorded the level of GDP per capita above the EU average in 2018.
Source: Monitor